Album of TA Diagrams
This page is dedicated to all thermoanalysts who do not want to take things as they are!
All the measurements shown below have been performed on a METTLER
TA1
or on the new FTA Low Temperature Device
at the "Institut für Anorganische Chemie der Universität
zu Köln" in Germany
by Jörg Wittrock.
Copyright information: All diagrams shown here either have been published (see references) or are the author's unpublished results! For further information please contact the author.
At the beginning of the album a few theoretical diagrams are shown
to
explain some properties of DTA curves.
| No. | DIAGRAM | DESCRIPTION |
| A1 |  |
The most simple differential temperature curve of an endothermal process is a first order phase transition. Each substance showing such a behavior can be used as a calibration standard. |
| A2 | 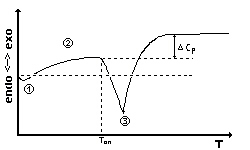 |
A theoretical melting curve: It begins with a starting turn due to the amount of reference substance(1). Then, the curve shows the course of heat capacity of the sample(2). While the substance is melting the slope of the signal depends on the heating rate. At point (3) the substance is completely molten and exponential relaxation appears. If the heat capacity Cp of the sample has changed during the phase transition the base line shifts to a different height. The melting temperature is observed as Tonset. |
| A3 | 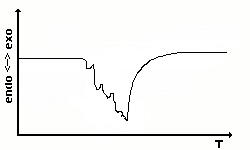 |
The sample is coarse-grained. To obtain a sharp signal the substance has to be pulverized. Sometimes, similar effects can be found which are caused by bubble formation in molten probes. |
| A4 | 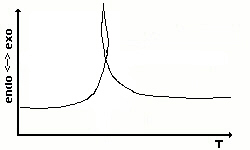 |
An enveloped curve can occur when a vehement chemical reaction takes place. In this case, we have to chose the timescale as x-axis and indicate the temperature as a further line in the diagram. |
| A5 | 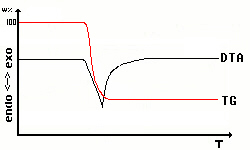 |
Watching chemical reactions involving the atmosphere like decomposition or synthesis it is always interesting to use differential thermal analysis and thermal gravimetrics simultaneously. This is a famous way to get ideas about chemical reactions and to distinguish them from phase transitions. Note that the y-axis has two different scales at a time - differential temperature and weight percent. |
| And now: | Some original diagrams | |
| 1 |  |
Thermal decomposition of PbO2 under pure oxygen
atmosphere.
Sample of 53 mg with 4 K/min. Red lead forms at 400°C and decomposes at more than 620°C under this conditions! Look at the sharp melting peak of PbO. Step 1: 3 PbO2 -> Pb3O4 + O2 Step 2: Pb3O4 -> 3 PbO + 1/2 O2 |
| 2 |  |
The oxidation processes of an intermetallic alloy "TlCu2" under oxygen was investigated to find the optimum conditions for synthesizing TlCu(CuO2). After evaluation of the data we where able to collect lots of crystals! This model substance was discovered by Arnold Adam, Claudia Felser-Wenz, H.-U. Schuster and R. Hoppe in 1991. Ref.: Z. Anorg. allg. Chem. 605 (1991) 157-62. |
| 3 |  |
The thermal behavior of NaK2H(CO3)2
*
2 H2O under argon, a beautiful example for a three step
decomposition.
This Hydrogencarbonate has been prepared in the Adam's
Group at the University of Cologne by Vytas Cirpus.
Ref.: A. Adam, V. Cirpus "Die ersten gemischten Alkalimetallhydrogencarbonate NaA2[H(CO3)2] * 2 H2O mit A = K, Rb" 25. GDCh-Hauptversammlung, Münster, Coll. Abstr. (1995) 483. |
| 4 |  |
NaK5[H(CO3)2]2
measured
under argon: at first sight it seems to be a one step decomposition,
but
actually two steps overlap. Pay attention to the change of slope in the
TG line! Vytas did it again.
Ref.: V. Cirpus, A. Adam "NaK5[H(CO3)2] - das erste wasserfreie Hydrogenbicarbonat" Z. Kristallogr., Suppl. Issue 15 (1998) 28. |
| 5 |  |
The same substance as above. The black lined measurement was taken under CO2 atmosphere. You will often observe troubled dT signals with carbon dioxide because of interactions between gas and substance surface. |
| 6 |  |
MgNiInHx - how much hydrogen could Axel Karge
from H.-U.
Schuster's stuff store in his compound? Nearly three weight percent!
The
argon atmosphere was not totally free from oxygen as the TG line shows.
Axel Karge, Dissertation Köln 1997. |
| 7 |  |
The synthesis of the high TC superconductor
Tl-2212 succeeds
by slow oxidation of a chilled alloy of the metallic components. The
oxidation
of a well prepared alloy proceeds in one step under control of the
thermal
parameters.
H.-U. Schuster, J. Wittrock: J. Thermal. Anal. 39 (1993) 1397-1401. |
| 8 |  |
DTA/TG measurement under ammonia! Meike Roos investigated the courses of the ammonolysis reactions of the ammonium hexafluorometalates (NH4)3MF6 (M = Al, Ga, In) with the aid of in-situ powder diffractometry and differential thermal analysis. After finding the optimum measuring parameters we got these amazing diagrams which respond great to the results of the other analytical investigations. This is the Al compound. |
| 9 |  |
A complex scheme for the reactions between (NH4)3GaF6
and NH3 forming many intermediates and resulting in GaN is
described
in:
Meike Roos, Jörg Wittrock, Gerd
Meyer, Silvia Fritz and Joachim Strähle:
Under 1 atm ammonia it looks quite simple so... |
| 10 |  |
A bucket of questions and results - the courses of the ammonolysis of (NH4)3InF6 are complex and full of surprises as Meike Roos and Gerd Meyer showed in Z. Anorg. Allg. Chem. 625 (1999) 1839. |
| 11 |  |
Low temperature thermal analysis near the melting point of
ice is quite
an expenditure. Our new device - available now at the FTA
- makes it easy to draw phase diagrams. A prototype has been developed
in the Adam's Group
at
the University of Cologne.
The system K2CO3 / H2O in the near of the cryohydratic point is shown. Consider that the curves shown are drawn as been measured - no flattening or adjusting of the base line has been necessary! |
| 12 |  |
Our title picture shows the DTA curves of the system K2CO3
/ H2O in the range from 0 to 75 weight % potassium
carbonate.
The two component regions appear as highland areas between the valleys
of phase transition.
For reference see our Phase Analysis Page. |
| 13 |  |
Arnold Adam and his group investigate the chemistry of carbonates and hydrogen carbonates of alkali and alkaline earth metals and in newer times peroxide containing compounds as well. The line in front shows melting and decomposition of Perhydrole while the lines behind contain amounts of KHCO3 resulting in lower decomposition temperatures. The dizziness of the lines results from bubble formation. Each bubble gives a little peak. |
| 14 |  |
Wegscheiderit Na2CO3 * 3 NaHCO3 - was the theme of this measurement. The Na2CO3 / NaHCO3 / H2O system is complex and includes Trona Na2CO3 * NaHCO3 * 2 H2O as well. See the displacements of the base lines resulting from the different heat capacities of the samples. |
| 15 |  |
Upside down - a part of the K2CO3 / H2O diagram is shown here. Sometimes the beginnings of the peaks appear more clearly when you choose this look. |
| 16 |  |
Iso(differential)thermal lines of the diagram No. 12 give an interesting view of the well known phase diagram. On single curves the anomalies observed could be interpreted as artifacts. But if nearly a hundred curves result in a coherence it is worth to take a closer look. We will report soon. |
| to be continued... | Thanks to all colleagues for the good time in Cologne! |
Comments welcome! fta@wittrock-web.de